
Variables
Description
What is this formula?
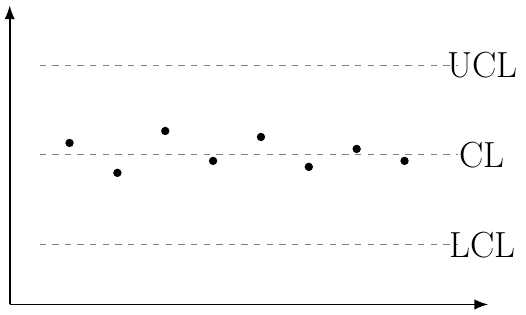
Upper and Lower Control Limits define the expected range of variation in a stable process.
They are the primary decision boundaries used in Statistical Process Control (SPC) charts to determine whether a process remains under statistical control.
When to use it
Use this formula when:
- Building control charts.
- Monitoring process stability.
- Detecting special-cause variation.
- Implementing SPC programs.
- Improving manufacturing quality.
Example
A process has:
μ = 100
σ = 4
Formulas:
UCL = μ + 3σ
LCL = μ − 3σ
Substitution:
UCL = 100 + (3×4)
UCL = 112
LCL = 100 − (3×4)
LCL = 88
Result:
UCL = 112
LCL = 88
Values outside this range may indicate that the process is no longer operating under statistical control.
Applications
- Statistical Process Control
- Six Sigma
- Manufacturing quality control
- Process monitoring
- Industrial quality engineering
Note
The ±3σ limits are based on the assumption of an approximately normal and stable process distribution. Alternative control chart methods may use different constants or limits depending on sample size, chart type, and industry standards.